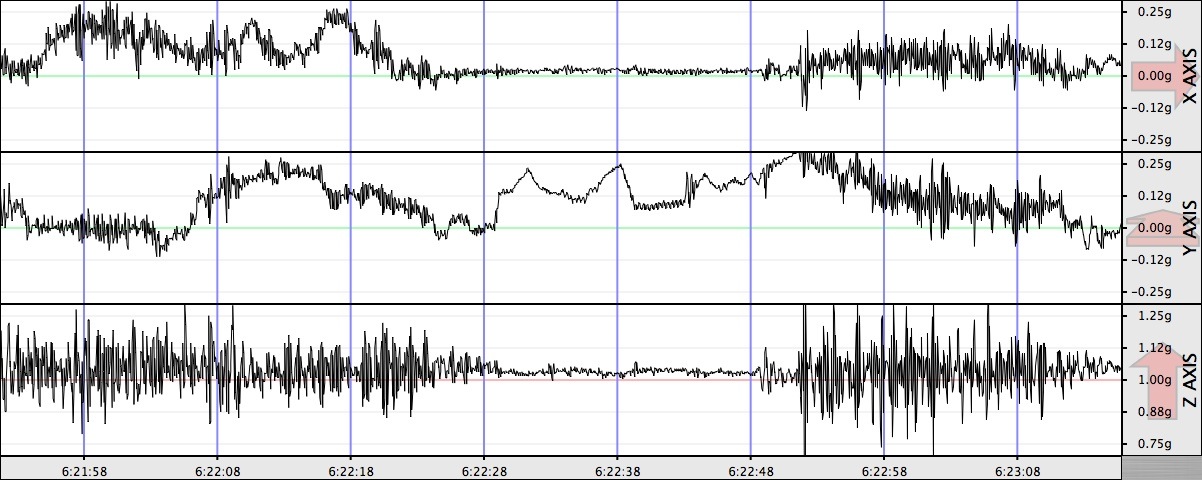
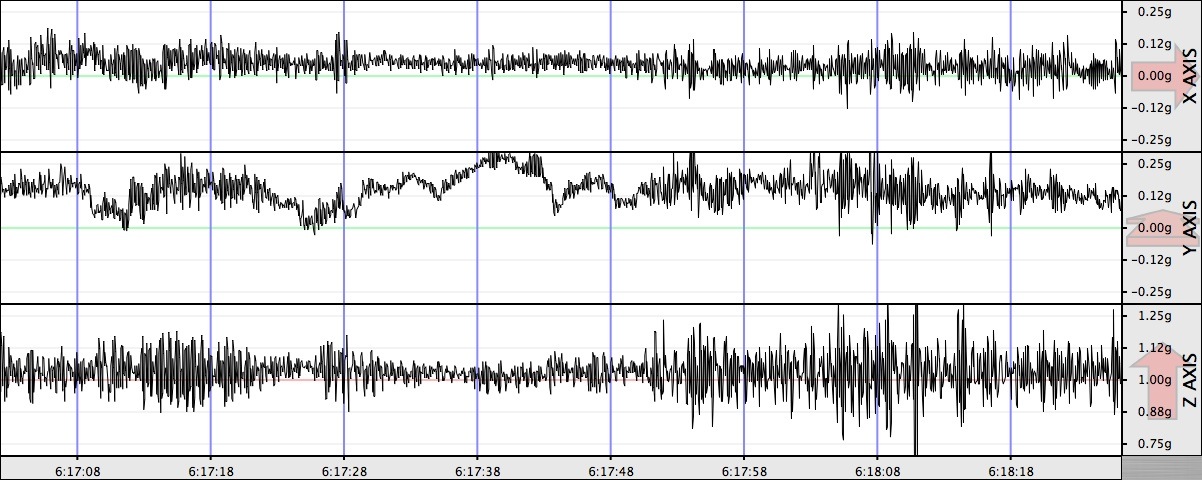
On a recent bus ride from work to the Vienna Metro station, I noticed the ride was rather rough and decided to take a closer look. Using SeisMac, a tool that uses my MacBook’s sudden motion sensor to take motion measurements, I recorded some key parts of the ride.
Because the computer was on my lap, the Y axis served as a crude accelerometer; when the bus accelerated, the front of the bus was raised a little (and I was therefore pitched back a little, causing the Y-axis reading to increase), and when the bus slowed down I was pitched forward, causing the Y-axis reading to decrease.
Exhibit 1: I-66
Getting on I-66, we began accelerating significantly at about 6:17:25. We hit traffic pretty abruptly and slowed down at 6:17:45, and then hit some rough potholes around :53 (see the Z-axis)…
Exhibit 2: Vienna Metro
Exiting I-66 to pull into the Vienna Metro station:

At 6:22:29, the bus was in a 3-way-stop traffic pattern at the Metro station (note how I was so violently pitched forward and backward). About 6:22:42, the bus made its final acceleration before letting the speed bleed off, coasting into its spot at the station.
Note: I originally posted this at livandan.com

That is pretty cool. I never thought of something like that.